Understanding FAIR: Quantifying Information Risk with Data, Not Guesswork
FAIR (Factor Analysis of Information Risk) transforms risk management from art to science. Instead of red-yellow-green heat maps, it quantifies information risk in financial terms, enabling executives to make transparent, data-driven decisions.
Arun Natarajan
5 min read


Understanding FAIR: Quantifying Information Risk with Data, Not Guesswork
In today’s digital enterprises, risk decisions are often made with subjective ratings — high, medium, low. Yet, in financial services and AI-driven environments, such qualitative models are no longer sufficient.
The FAIR (Factor Analysis of Information Risk) framework offers a quantitative, defensible way to measure and communicate cyber and operational risk in financial terms.
Why Traditional Risk Scoring Falls Short
For years, risk assessments have relied on color-coded heat maps and control self-assessments. While simple, these approaches are inherently subjective, leading to inconsistent outcomes:
“High risk” in one department might be “medium” in another.
Risk prioritization often depends on human judgment, not data.
Business leaders struggle to connect risk exposure to actual financial impact.
This gap between risk language and business language is precisely what FAIR aims to close.
What Is the FAIR Model?
FAIR — short for Factor Analysis of Information Risk — is an open standard developed by the FAIR Institute and now maintained by The Open Group (as Open FAIR™).
It provides a structured taxonomy and quantitative model to understand, analyze, and measure information risk in financial terms — typically in loss event frequency and loss magnitude.
At its core, FAIR transforms abstract risk concepts into measurable factors. It enables organizations to answer questions like:
“How much financial loss could this risk scenario cause, and how often might it occur?”
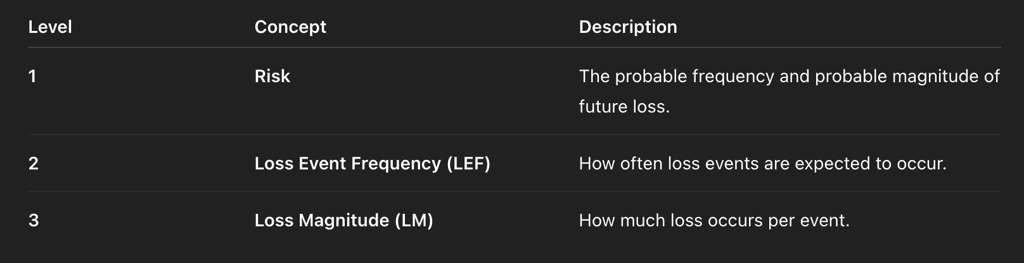
The FAIR Risk Analysis Structure
The FAIR model is built around two main components:
FAIR decomposes these into finer layers such as Threat Event Frequency, Vulnerability, and Primary/Secondary Loss Magnitude to arrive at a realistic distribution of outcomes.
For example:
A cyberattack scenario might have a 5% annual probability.
The expected loss magnitude may range from $200K to $2M, with a most likely value of $800K.
This allows the organization to express risk as a range of potential losses, enabling better capital allocation and control prioritization.
Key Components Explained
Threat Event Frequency (TEF): How often a threat agent acts against an asset.
Vulnerability: The probability that an attack results in a loss event.
Loss Event Frequency (LEF): Product of TEF and Vulnerability.
Loss Magnitude (LM): The probable loss amount per event.
Primary Loss: Direct loss (e.g., fraud, data breach response, downtime).
Secondary Loss: Indirect losses (e.g., regulatory fines, customer churn, brand damage).
Together, these components allow risk analysts to build Monte Carlo simulations that output a full loss distribution, not a single number.
The FAIR Process – Step-by-Step
Define the Risk Scenario
Clearly identify who, what, and how:“A malicious insider exfiltrating customer data from cloud storage.”
Identify Relevant Factors
Break down the scenario into TEF, Vulnerability, and LM.Estimate Values Using Data or Expert Elicitation
Use historical incident data, control metrics, or expert judgment.Run Simulations (Monte Carlo)
Model thousands of outcomes to visualize potential loss ranges.Interpret and Report Results
Present the expected annualized loss (ALE), along with percentiles (P90, P95) for decision-making.Recommend Controls or Mitigation Actions
Quantify how control improvements (e.g., enhanced monitoring) reduce expected loss.
Example — Translating Cyber Risk into Financial Terms
ScenarioDescriptionExpected Annualized Loss (ALE)Ransomware attackEncrypted production servers, 2-week outage$2.4MData breach (PII)Loss of 100K customer records$1.1MCloud misconfigurationExposure of sensitive reports$400K
With FAIR, leadership teams can compare these quantified risks to budget and risk appetite, guiding investment decisions in a transparent, defensible way.
FAIR and Compliance Frameworks
FAIR doesn’t replace traditional governance standards — it complements them by adding a quantitative layer.
FrameworkHow FAIR Fits InNIST CSF / NIST 800-53Adds financial quantification to “Identify” and “Respond” functions.ISO 27001 / ISO 42001Supports risk evaluation by providing probabilistic impact modeling.DORA (EU)Enables quantitative ICT risk measurement in financial services.Basel/FFIEC GuidanceAligns operational risk capital with measured loss exposure.
This makes FAIR particularly valuable for banks, insurers, and fintechs seeking model risk validation and audit-ready risk quantification.
Benefits for Risk, Finance, and Governance Leaders
RoleBenefitCIO / CISOQuantifies cyber risk to justify security budgets.CRO / Risk ManagerConnects controls to measurable risk reduction.CFO / FinanceTranslates technology risk into financial exposure.Board & RegulatorsEnables transparent, evidence-based risk discussions.
FAIR transforms risk from a compliance checkbox to a strategic decision tool.
FAIR in AI and Model Risk Context
As AI systems become central to decision-making, FAIR’s methodology can be adapted to AI risk quantification:
Model bias and drift → frequency of adverse outcomes.
Explainability gaps → vulnerability factors.
Financial exposure → potential regulatory fines or customer impact.
FAIR aligns with NIST AI RMF and ISO 42001 principles by promoting measurable, traceable, and repeatable risk quantification.
Challenges and Considerations
Data Availability: Requires credible historical or simulated data.
Training: Analysts must understand both risk modeling and statistical simulation.
Cultural Shift: Moving from qualitative to quantitative thinking takes time.
Despite these, FAIR adoption is accelerating — particularly among U.S. financial institutions, cyber insurers, and regulatory bodies that now expect evidence-based risk reporting.
Final Thoughts
FAIR transforms how organizations perceive risk — from gut-feel assessments to data-driven decisions.
By quantifying risk in dollars and probabilities, leaders can communicate with clarity, prioritize effectively, and align controls to business value.
In a world where AI, cloud, and cyber threats intersect, FAIR bridges the gap between risk, finance, and governance — turning uncertainty into actionable intelligence.
For more interesting contents, follow me on
© PRODCOB.com | @brownmansocial | www.linkedin.com/in/arun-natarajan
#RiskManagement #FAIR #CyberRisk #AI #Governance #Compliance
References
The Open Group. (2022). Open FAIR™ Risk Taxonomy Standard (O-RT), Version 2.0. Retrieved from https://www.opengroup.org/openfair
The Open Group. (2022). Open FAIR™ Risk Analysis Standard (O-RA), Version 2.0. Retrieved from https://publications.opengroup.org/standards/security/standards/s181
FAIR Institute. (2024). Factor Analysis of Information Risk (FAIR) — Quantitative Risk Management Framework. Retrieved from https://www.fairinstitute.org/
Jones, J., & Freund, J. (2014). Measuring and Managing Information Risk: A FAIR Approach. Elsevier / Butterworth-Heinemann. Retrieved from https://www.oreilly.com/library/view/measuring-and-managing/9780124202313/
ISACA. (2016). FAIR: The Standard Model for Information Risk. ISACA Journal, Vol. 1. Retrieved from https://www.isaca.org/resources/isaca-journal/issues/2016/volume-1/fair-the-standard-model-for-information-risk
NIST. (2024). Cybersecurity Framework (CSF 2.0). National Institute of Standards and Technology. Retrieved from https://www.nist.gov/cyberframework
NIST. (2023). AI Risk Management Framework (AI RMF 1.0). National Institute of Standards and Technology. Retrieved from https://www.nist.gov/ai-risk-management
ISO. (2022). ISO/IEC 27001:2022 – Information Security, Cybersecurity, and Privacy Protection — Information Security Management Systems. Retrieved from https://www.iso.org/standard/82875.html
European Commission. (2024). Digital Operational Resilience Act (DORA) Framework. Retrieved from https://finance.ec.europa.eu/regulation-and-supervision/financial-services-legislative-framework/digital-operational-resilience_en
FAIR Institute. (2023). Case Study: Quantifying Risk at JPMorgan Chase. Retrieved from https://www.fairinstitute.org/resources/case-study-jpmorgan-chase-quantitative-risk-management
Gartner. (2023). Move Beyond Heat Maps: Quantify Cyber Risk with FAIR. Gartner Research Report ID G003985601. Retrieved from https://www.gartner.com/en/documents/3985601
World Economic Forum. (2024). Global Risks Report 2024. Retrieved from https://www.weforum.org/reports/global-risks-report-2024
Carnegie Mellon University, CERT / SEI. (2023). Quantitative Cyber Risk Analysis and FAIR Methodology Alignment. Software Engineering Institute. Retrieved from https://resources.sei.cmu.edu/library/asset-view.cfm?assetid=9671
Disclaimer
The views expressed in this article are solely my own and are based on a review of publicly available information from reputable sources and industry analyses. This content is intended for educational and informational purposes only and does not represent the views, policies, or positions of my employer or any other organization. Readers should consult the official Guidelines and professional advisors for specific compliance or implementation guidance.